How to Monitor Your Airtable Automations (And Know When They Fail)
You have automations running on schedules, one every Monday, one midweek, and one Friday evening. They seem to be working. But how do you actually know? Is there a way to confirm each one fired, see what it did, and get alerted when something goes wrong?
Yes, and Airtable has more built-in monitoring than most people realise. Here is what exists natively, and how to go further with a custom run log.
What Airtable Provides Natively
The Run History Panel
Every automation in Airtable has its own run history. To access it:
-
Open your base and click Automations in the top toolbar
-
Click the automation you want to inspect from the left sidebar
-
Click the Automation history button (clock icon) in the top-right of the automation editor
This opens a panel showing every time the automation ran, whether it succeeded or failed, and a timestamp for each run.
Clicking on any run expands it to show the details of what happened at each step, including what values were read, what records were created or updated, and what emails were sent. If a step failed, it shows you the exact error.
You can filter runs by All, Succeeded, Failed, or Cancelled. The time shown is in your local timezone.
Within the same panel, there is a Version history tab that shows every change ever made to the automation, including who changed it and when. This is useful when an automation that used to work has suddenly stopped and you need to trace back what changed.
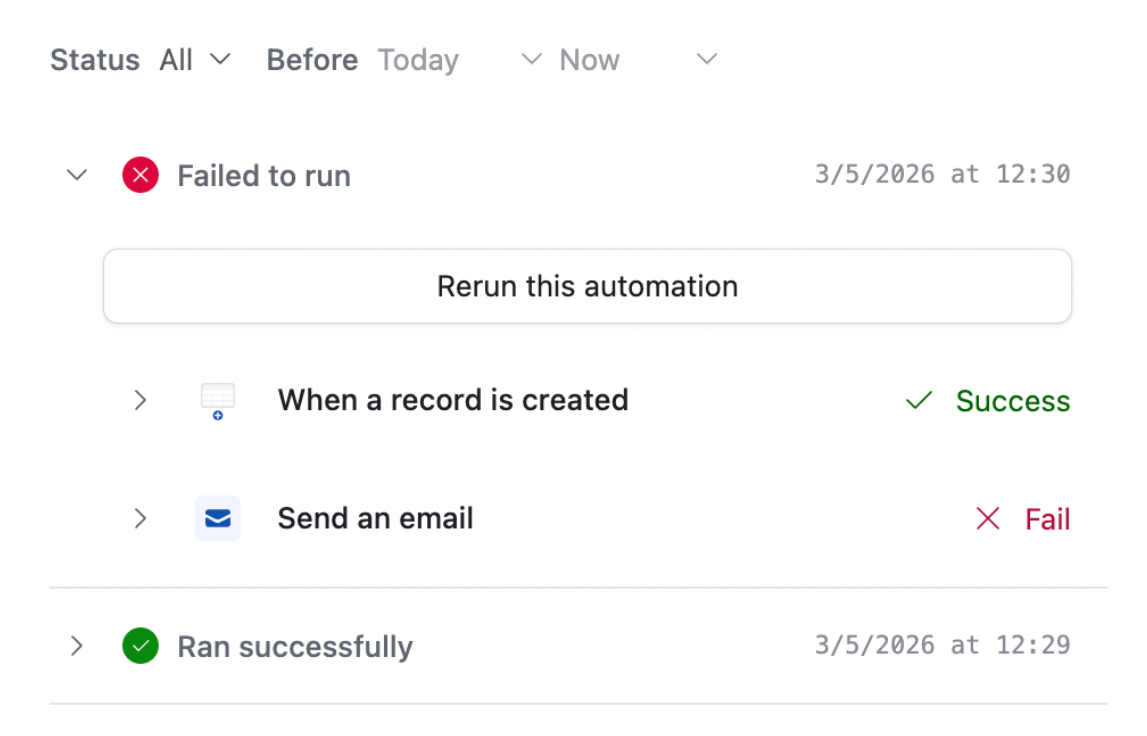
Rerunning Failed Automations
From the run history, you can click Rerun on any failed run. This attempts to execute the automation again using the same data it had when it originally ran. This is useful for one-off failures caused by temporary issues like network errors or empty fields that have since been filled in.
Note: rerunning will not work if the underlying problem has not been fixed. If the automation failed because a record was missing a required email address, rerunning will fail again until that address is added.
Email Notifications for Failures
Each automation has a subscriber list that controls who receives email notifications when it fails. By default, the person who created and enabled the automation is subscribed.
To manage subscribers:
-
Open the automation
-
Click the ... menu at the top of the automation editor
-
Select Manage notification subscribers
-
Add or remove email addresses (you can add up to 10 subscribers per automation)
Only collaborators with Owner or Creator access to the base can be added as subscribers. You can also add service accounts connected to distribution lists, which lets you notify a team channel rather than individual emails.
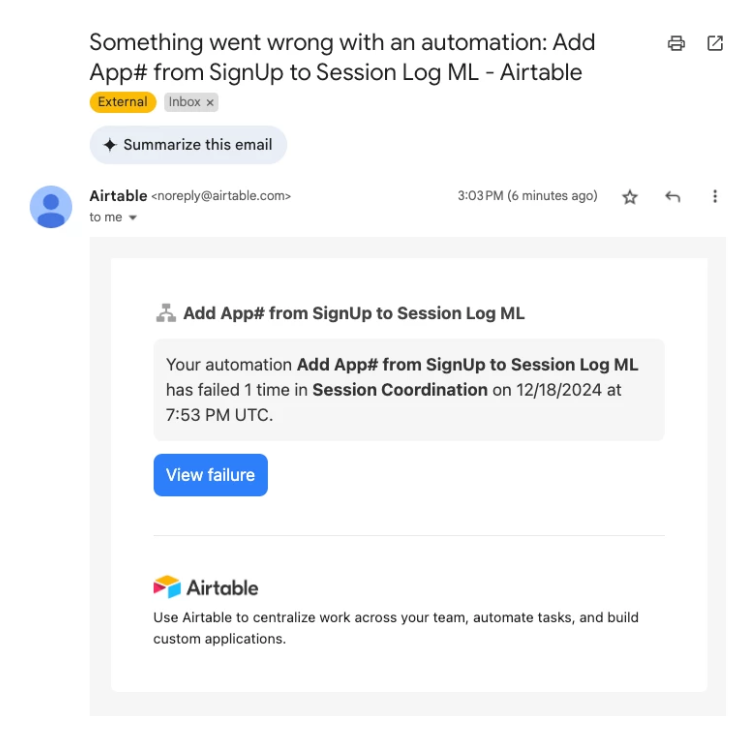
When an automation fails, everyone on the subscriber list receives an email with a link directly to the failed run in the run history. This is the fastest way to find out something has gone wrong without having to check Airtable manually.
Checking Run Usage Across the Workspace
If you want to see automation run totals across all bases in a workspace (not just one automation), go to your Airtable home screen, click your workspace name, and look for the Usage section. This shows total automation runs consumed for the billing period and your plan's monthly limit.
This is useful for spotting whether a particular automation is consuming a disproportionate number of runs, which might indicate it is firing more often than intended.
The Limitation: No Cross-Automation Dashboard
Airtable's native run history is per-automation only. There is no built-in dashboard that shows all your automations in one view, with a timeline of when each one ran. You have to open each automation individually to check its history.
This is the gap: a view that shows everything at a glance. For that, you need to build it yourself.
Building a Visual Automation Run Log
The approach is to have each automation log its own run to a dedicated table, then visualise that table as a calendar or timeline view.
Step 1: Create the Automation Logs table
Create a new table in your base called Automation Logs. Add these fields:
-
Automation Name (single line text) - which automation ran
-
Ran At (date, include time) - when it ran
-
Status (single select) - options: Success, Failed, Partial
-
Notes (long text) - any relevant output or error detail
-
Records Affected (number) - how many records were processed, if relevant
Step 2: Add a Create Record action at the end of each automation
In each automation you want to track, add a Create record action as the final step. Set the table to Automation Logs and populate the fields:
-
Automation Name: type the name of this automation as a static value
-
Ran At: use the Automation run time token from the field picker
-
Status: set to "Success" as a static value (this step only runs if the automation completed)
-
Notes: optionally include a summary using tokens from earlier steps
Because this step only executes if all previous steps completed, a record in Automation Logs with Status "Success" means the automation ran without error.
Step 3: Set up the calendar view
In the Automation Logs table, create a Calendar view. Set the date field to Ran At. You will see each automation run appear as an event on the calendar on the day it ran.
Use the colour-by field to colour events by Automation Name. Now each automation appears in a different colour, giving you the at-a-glance schedule view you wanted.
Optionally: Add a Timeline view
If you want to see multiple automations side by side in a timeline (rather than a traditional calendar), create a Timeline view instead. Set the start date to Ran At and the record title to Automation Name. Group by Automation Name to see each automation as its own row, with runs plotted along the timeline.
The limitation of this approach
Within the same panel, there is a Version history tab that shows every change ever made to the automation, including who changed it and when. This is useful when an automation that used to work has suddenly stopped and you need to trace back what changed.
For failure detection, combine this with the email notification subscribers approach above. The built-in failure alert tells you when something breaks; the Automation Logs calendar tells you your automations are running consistently when everything is healthy.
Linking Runs Back to Affected Records
If you want to trace exactly which records an automation touched, Airtable's record-level revision history can help. Open any record, expand it, and click the Revision history tab. Changes made by automations are tagged as such and can be clicked to open the associated automation run in the run history panel.
This is useful for investigating unexpected changes. If a record looks wrong, you can see exactly which automation changed it and when.
For more on managing automation run quotas and preventing your monthly limit from being exhausted, see How to Limit Automation Runs in Airtable to Avoid Running Out of Quota.
If you are hitting the 50-automation limit and need to consolidate or restructure your automations, see Hitting Airtable's 50 Automation Limit? Here's What You Can Do.