How to Take Regular Snapshots of Your Data in Airtable
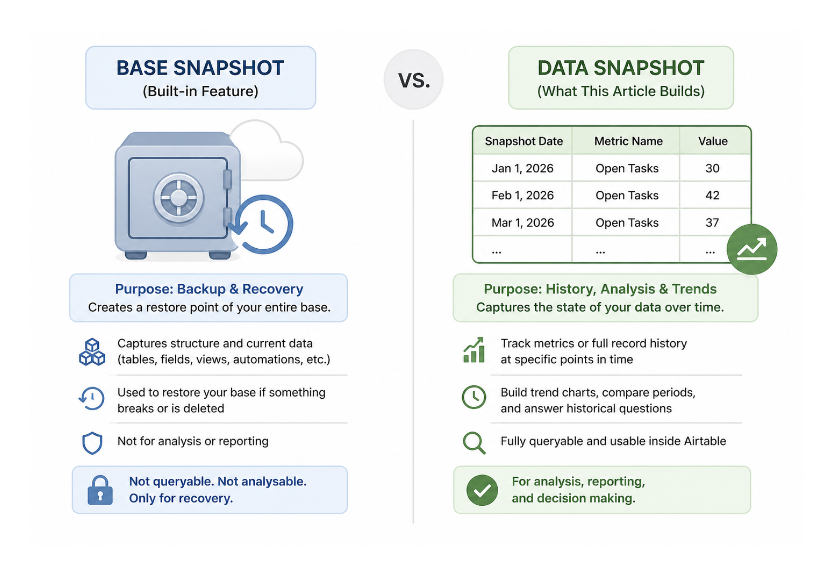
Airtable's built-in snapshot feature saves a copy of your base at a point in time. If something goes wrong structurally, you can restore from it. But it does not help you answer questions like "what did our pipeline look like three months ago?" or "how many open tasks did we have at the end of Q1?"
For that kind of historical tracking, you need to build a data snapshot system inside Airtable itself.
This is different from the base-level snapshot feature. Base snapshots capture structure and current data for recovery purposes. Data snapshots capture the state of specific values at a point in time for analysis and trend tracking.
Here are two approaches depending on whether you need summary totals or individual record history.
When to Use Each Approach
Use summary snapshots when you care about aggregated numbers over time: total pipeline value, number of open tasks, average deal size, monthly revenue. You want a trend line, not individual record history.
Use record snapshots when you need the full picture of individual records at specific points in time: how each deal's status changed month by month, what the complete state of your inventory looked like at end of quarter, the full history of a specific project's metrics.
Approach 1: Summary Snapshots (Track Totals Over Time)
Step 1: Create a Summary Table
In your base, create a new table called Summary. This table will contain one record for each metric you want to track, with fields that pull live calculations from your main table.
Add these fields:
-
Metric Name (single line text) - e.g. "Total open tasks", "Pipeline value", "Active customers"
-
Current Value (rollup) - pulls the live calculation from your main table
-
Last Updated (last modified time) - automatically updates when the record changes
For rollup fields to work, you need a linked record relationship between the Summary table and your main table.
Step 2: Create a Snapshot Table
Create another table called Data Snapshots with these fields:
-
Snapshot Date (date) - when this snapshot was taken
-
Period Label (formula) - e.g.
DATETIME_FORMAT({Snapshot Date}, 'MMM YYYY')to generate "Jan 2026" -
Metric Name (single line text) - copied from Summary
-
Value (number) - the value captured at that moment
-
Notes (long text, optional) - any context about this period
Step 3: Set Up the Scheduled Automation
Create a new automation with the trigger At a scheduled time. Set it to run weekly (every Sunday night) or monthly (first day of the month at midnight).
Add a Find records action targeting your Summary table to retrieve all metric records.
Then add a Create record action targeting the Data Snapshots table. Map the fields:
-
Snapshot Date → use the Automation run time token from the field picker
-
Metric Name → map from the found Summary record's Metric Name field
-
Value → map from the found Summary record's Current Value field
If you have multiple metrics in the Summary table, add an Iterator to loop through each one and create a snapshot record for each.
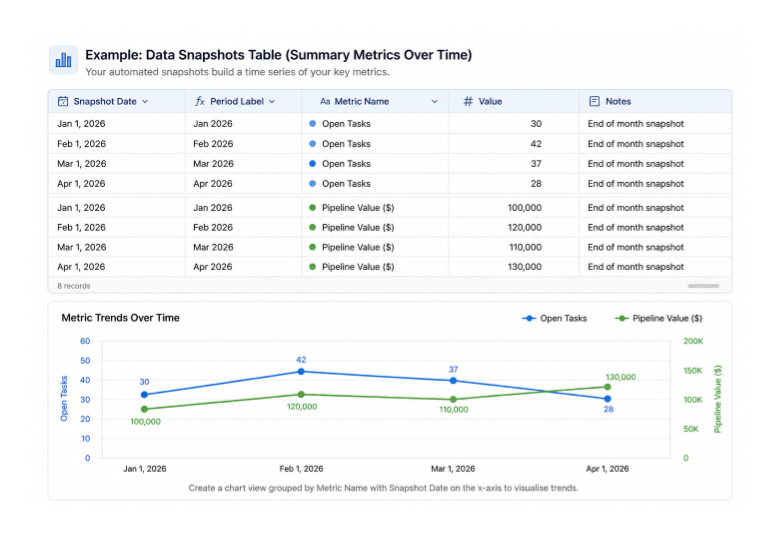
What you get
After a few weeks or months, your Data Snapshots table contains a time series of your key metrics. Create a chart view grouped by Metric Name with the x-axis as Snapshot Date to visualise how each metric has trended over time.
Approach 2: Record Snapshots (Full State of Each Record at a Point in Time)
When you need to preserve the full state of individual records, not just aggregates, the approach is to copy records from your main table into an archive table on a schedule.
Step 1: Create the Archive Table
Create a table called [Table Name] Archive with the same fields as your main table, plus two additional fields:
-
Snapshot Date (date) - when this record was captured
-
Period Label (formula) -
DATETIME_FORMAT({Snapshot Date}, 'MMM YYYY')
You do not need to include every field from the main table - only the ones you want to track over time.
Step 2: Set Up the Scheduled Automation
Create a scheduled automation with the same cadence as above (weekly or monthly).
Add a Find records action to retrieve all records from your main table. You can add conditions here to filter. For example, only snapshot records where Status is “Active” rather than copying every record, including archived ones.
Add an Iterator to loop through the results.
Inside the iterator, add a Create record action targeting your Archive table. Map all the fields from the main table record to the archive table, plus set Snapshot Date to the current run time.
Handling Large Tables
If your main table has thousands of records, the scheduled automation may time out before processing all of them. The 30-second script limit applies here.
For large tables, use a Run a script action instead of Find records + Iterator. The script can fetch records in batches of 50 using the Airtable API and create archive records efficiently. See How to Deal With Airtable's 30-Second Script Limit in Automations for the batching pattern.
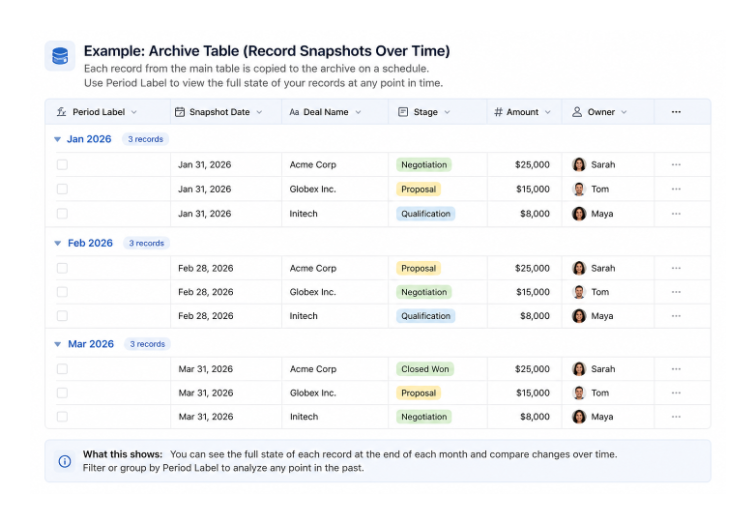
What you get
Your archive table builds up a month-by-month or week-by-week history of every record. Filter by Period Label to see a full snapshot of your data at any past point. Use a grid view with grouping by Period Label to compare periods side by side.
Complementing This With Base Snapshots
The data snapshot system described above captures what your data looked like over time. Airtable’s built in base snapshot feature, available on all plans, captures the structural state of the base, including field types, automations, and interfaces, for recovery purposes.
They two serve different purposes and both are worth having. Take manual base snapshots before any significant structural changes, and let your automated data snapshot system run in the background to preserve your data history.
For a full explanation of Airtable's base snapshot feature including plan-level retention and how to restore, see How to Back Up Your Airtable Bases (And Restore Them Safely).
If you want to monitor your automations to confirm the snapshot automation is running successfully each period, see How to Monitor Your Airtable Automations.