How to Create Charts and Graphs in Airtable
Need to turn Airtable records into a chart? Use the Chart extension for a quick chart inside your base. Use a Chart element in an Interface dashboard when you need to share the report.
Create a chart inside your base
The Chart extension is available on paid Airtable plans. It uses the records in a table or view and is useful when you want to explore the data without building a dashboard.
Open the base, click Tools, and select Extensions. Click Add an extension, search for Chart, and add it to the base.
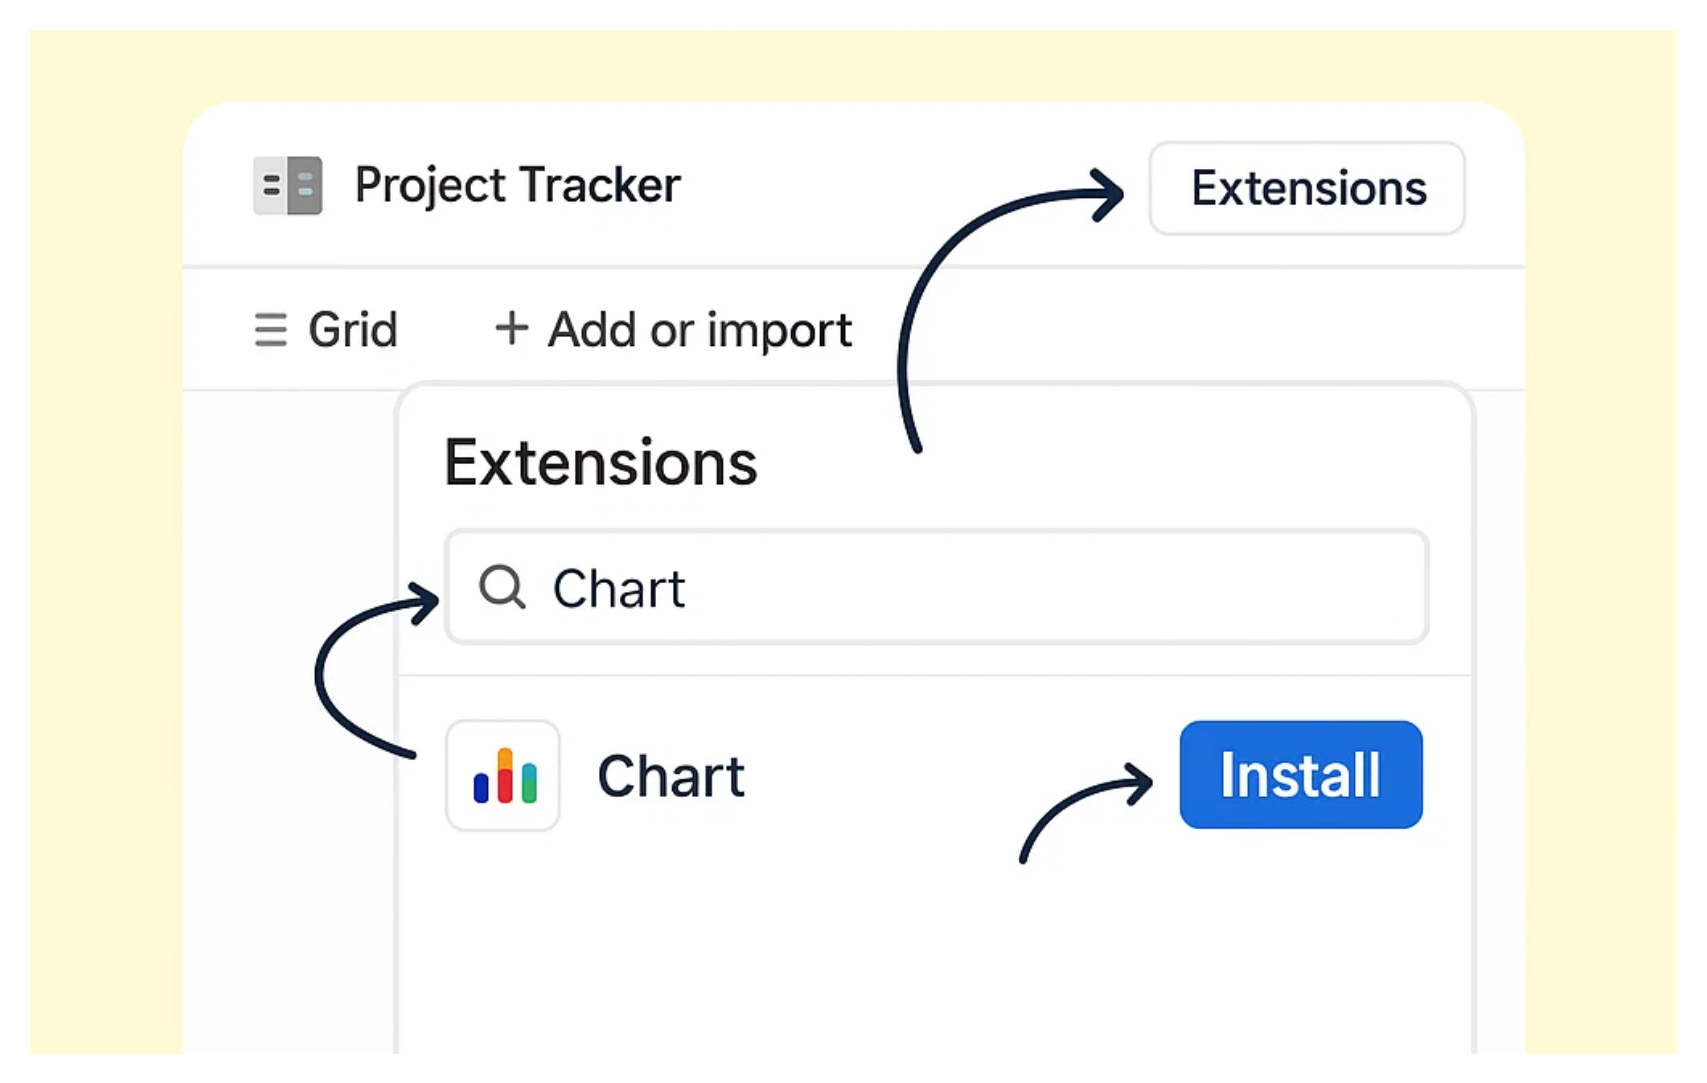
Choose the table and view you want to use. The chart uses the records visible in that view, so set up the view's filters first if you only want to include part of the data.
Choose a chart type, then select the fields for the axes. Airtable can count records or summarize a numeric field using values such as sum, minimum, maximum, or mean.
The extension supports bar, line, scatter, pie, and donut charts. Use a bar chart to compare categories, a line chart to show a trend, a scatter chart to compare two numeric fields, and a pie or donut chart to show proportions.
The extension is useful for analysis inside the base. It does not provide a native export or print option for the chart.
Add a chart to an Interface dashboard
Use an Interface when the chart needs to sit beside other information or be shared with people who do not need to work in the base.
Open Interfaces, create or open a Dashboard page, and click Add element. Choose Chart, then select the table and view that contain the records you want to report on.
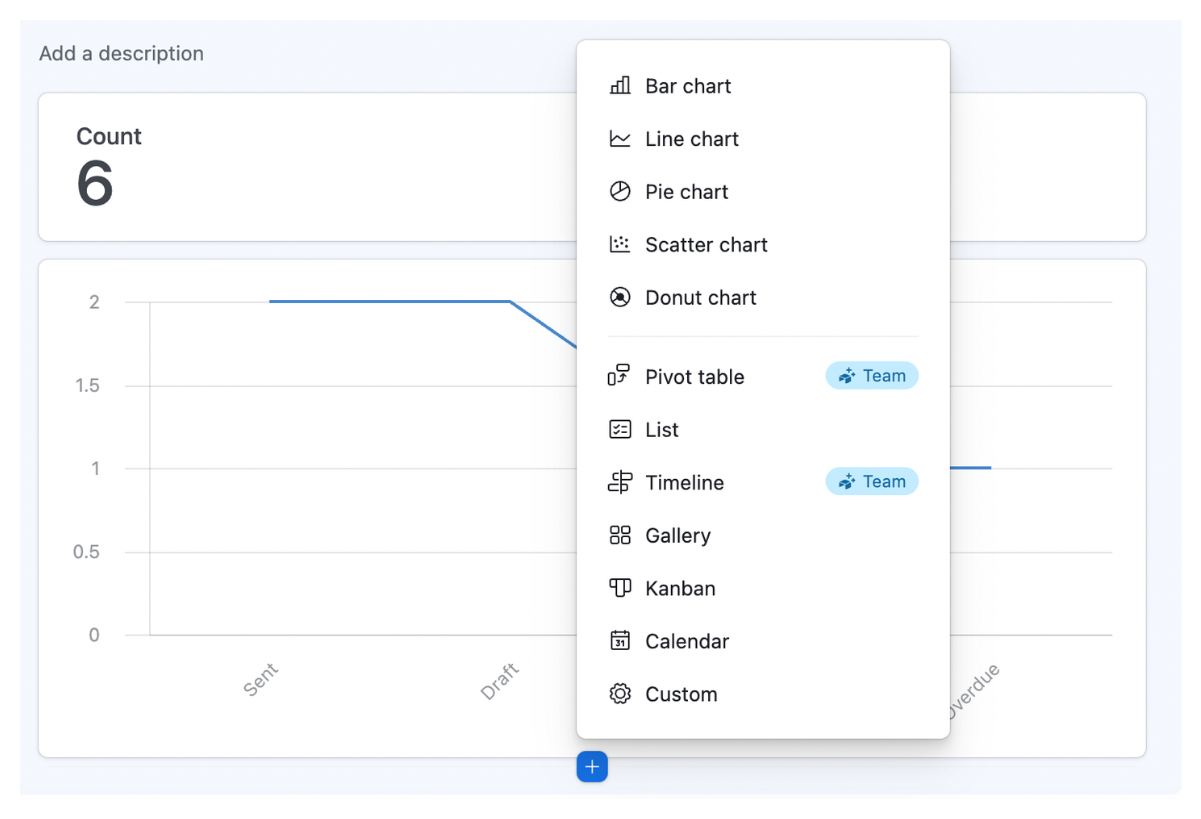
Choose the chart type and configure the axes or categories. You can add filters to the chart and place it beside number elements, record lists, or other charts on the same page. Publish the Interface when the dashboard is ready to share.
Interface charts support bar, line, scatter, pie, and donut charts. Bar, line, and scatter charts can also use multiple series or two Y-axes when one chart needs to compare different values.
If the chart should show information from linked records on one record's detail page, add the chart to that record detail layout instead of the dashboard. Airtable can use a linked record field as the chart's source.
For help building a broader Airtable reporting setup, see how to connect Airtable to dashboard and reporting tools. If you need to compare records across financial years in an Interface chart, see how to compare records across financial years in Airtable.