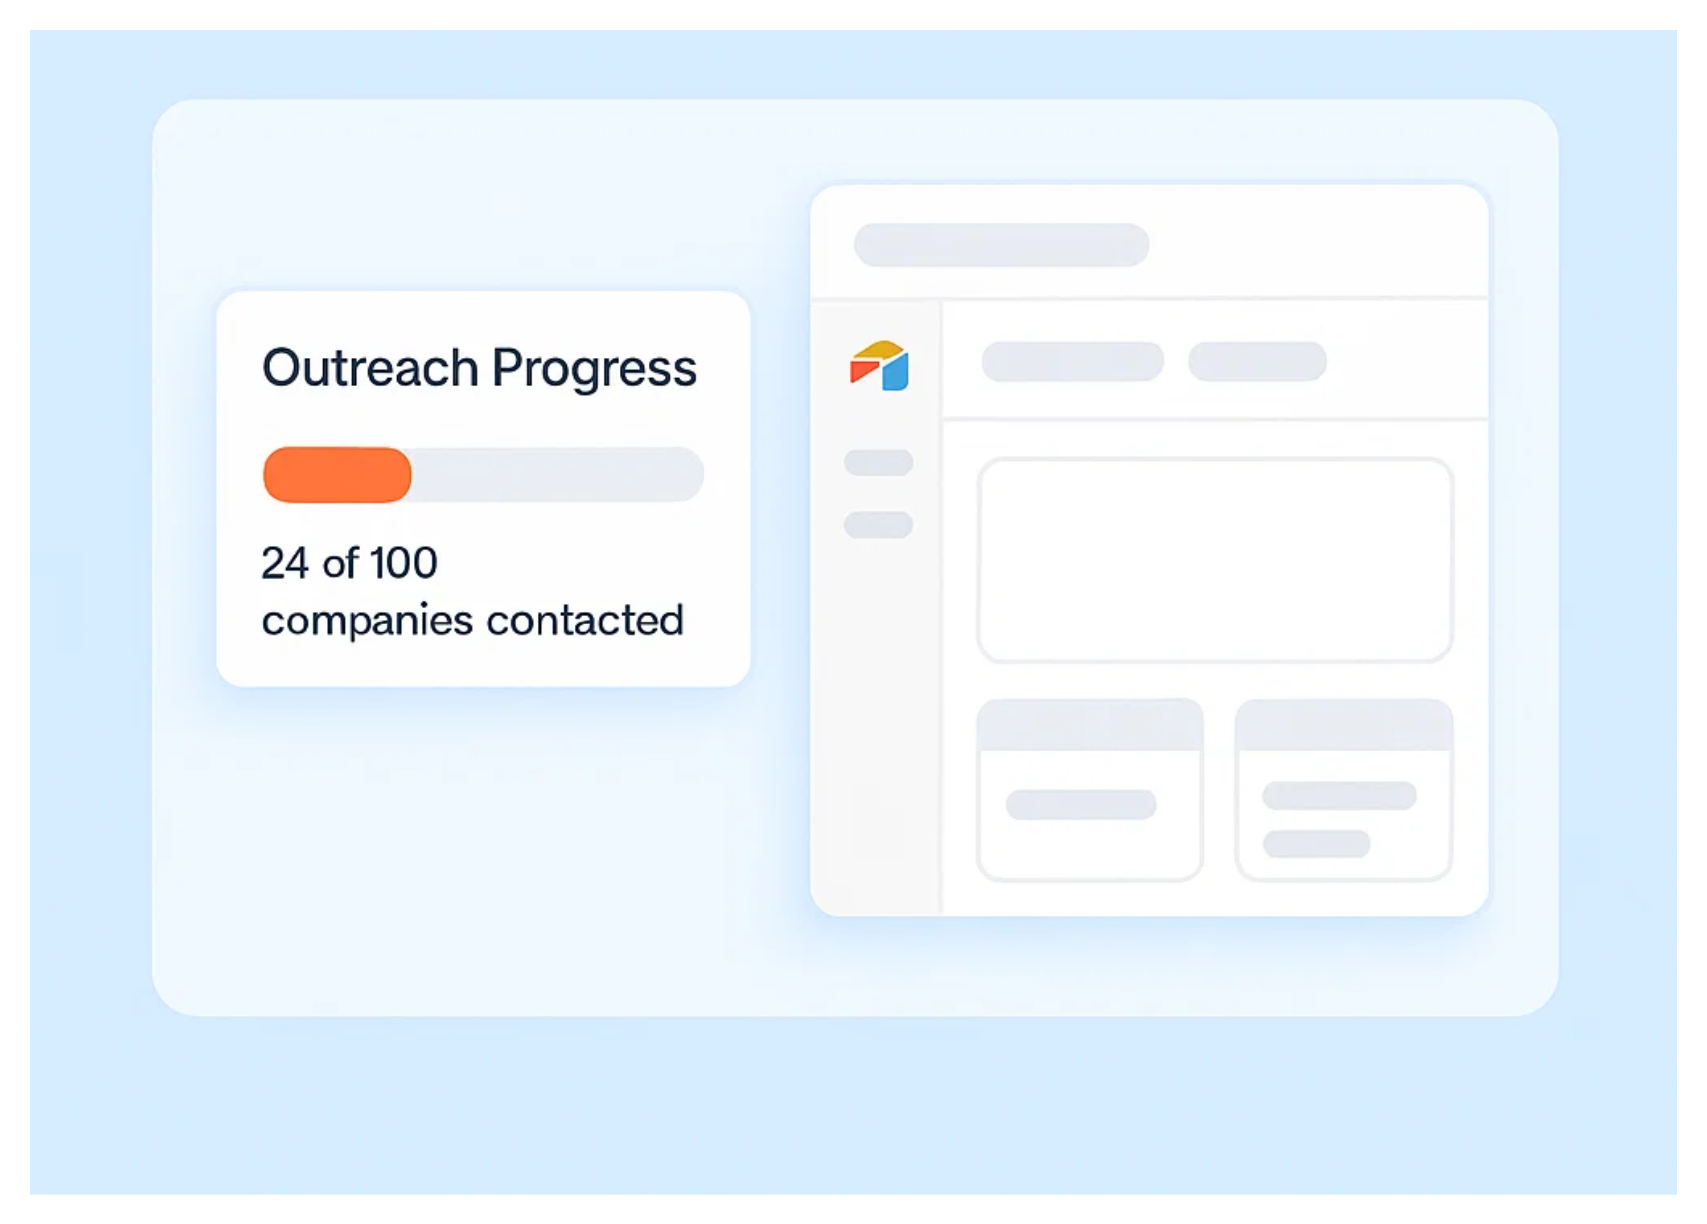
Suppose you have a goal to contact 100 companies this month.
So far, you've contacted 24.
You could display:
24%
But when you're building an Airtable Interface, a progress bar makes it much easier to see how close you are to your goal.
Airtable has this built in. You don't need an extension or a custom progress bar formula.
Calculate your progress
First, you need a field that gives Airtable your progress as a percentage.
For example, you might have:
Companies Contacted: 24
Goal: 100
Create a formula field:
{Companies Contacted} / {Goal}
The result is:
0.24
Now open the field settings and format the result as a Percent.
Airtable displays that as:
24%
Don't multiply the formula by 100. Airtable's percentage formatting handles that for you.
Display the percentage as a progress bar
In the field's formatting settings, enable:
Display as progress bar
You can also choose whether you want the percentage value displayed alongside the bar.
Your 24% value will now appear visually as a partially filled progress bar.
Add it to your Interface
Once the field is formatted as a progress bar, add that field wherever you need it in your Interface.
You don't need to build another progress bar inside Interface Designer.
Airtable carries the field's progress-bar formatting into Interfaces automatically.
As the underlying percentage changes, the progress bar changes with it.
You aren't limited to formula fields
You can use progress-bar formatting with several field types.
Airtable supports it for:
- Percent fields
- Formula fields with a numeric result
- Rollup fields with a numeric result
- Lookup fields containing a single numeric value
For computed fields, format the result as a Percent and then enable the progress bar.
This means you can use the same feature for things like task completion, budgets, fundraising goals, project milestones, or sales targets.
For example, if you're tracking completed subtasks, you could calculate:
Completed Subtasks / Total Subtasks
Then format the result as a percentage and display it as a progress bar.
You end up with a simple visual indicator that updates automatically as the underlying data changes.